Getting Started with Kaluza: Overlays
Introduction
For flow cytometry experiments it is often desirable to compare expression patterns between populations or even between samples from different time points or stimulation conditions. Overlay plots contain multiple histograms, dot or density plots in a single plot, allowing the user to compare patterns, see Figure 1.

Figure 1. Overlay Examples from Whole Blood Samples. Overlay examples from whole blood samples with and without stimulation using DURActive 3 (Part Number C21857) per manufacturer's instructions. Samples were stained with DURAClone IF Monocyte Activation Antibody Panel (Part Number C21858) following the IFU and data was acquired on CytoFLEX flow cytometer. A) Shown is a dot plot overlay from a control sample gated on CD14+ cells and stimulated samples gated on a granulocyte (Gra) gate and CD14+ cells. B) Histogram overlay of the unstimulated control and the DURActive 3 stimulated samples. Plots are for illustration purposes only.
In Kaluza Analysis, Overlay plots can be used as a data comparison tool in individual data sets, merged data sets and Composite data sets. You can compare up to 12 plots in an Overlay plot and different histogram visualizations such as offset or angled options are available, see Figure 2.
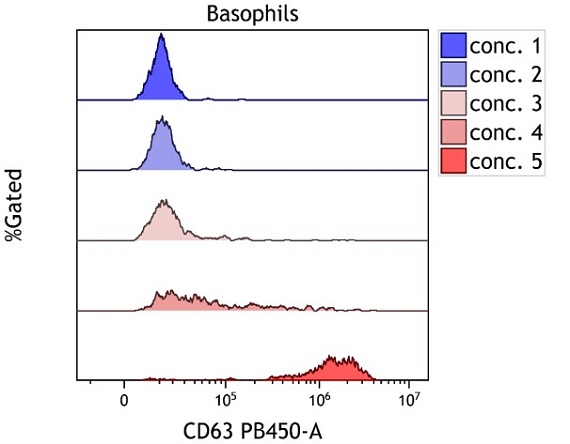
Figure 2. Offset Histogram Overlay. Offset histogram overlay of 5 whole blood samples treated with increasing concentrations of stimulus, stained using DURAClone IF Basophil Activation Antibody Panel (Part Number C23406) per manufacturer’s instructions and acquired on a CytoFLEX flow cytometer. Plots are for illustration purposes only.
Comparing Populations Within One Data Set
For detailed instructions for loading files and creating analyses including plots and gates please refer to Kaluza Analysis Flow Cytometry Software IFU C10986.
- Load the data files to be analyzed and identify the populations to be compared.
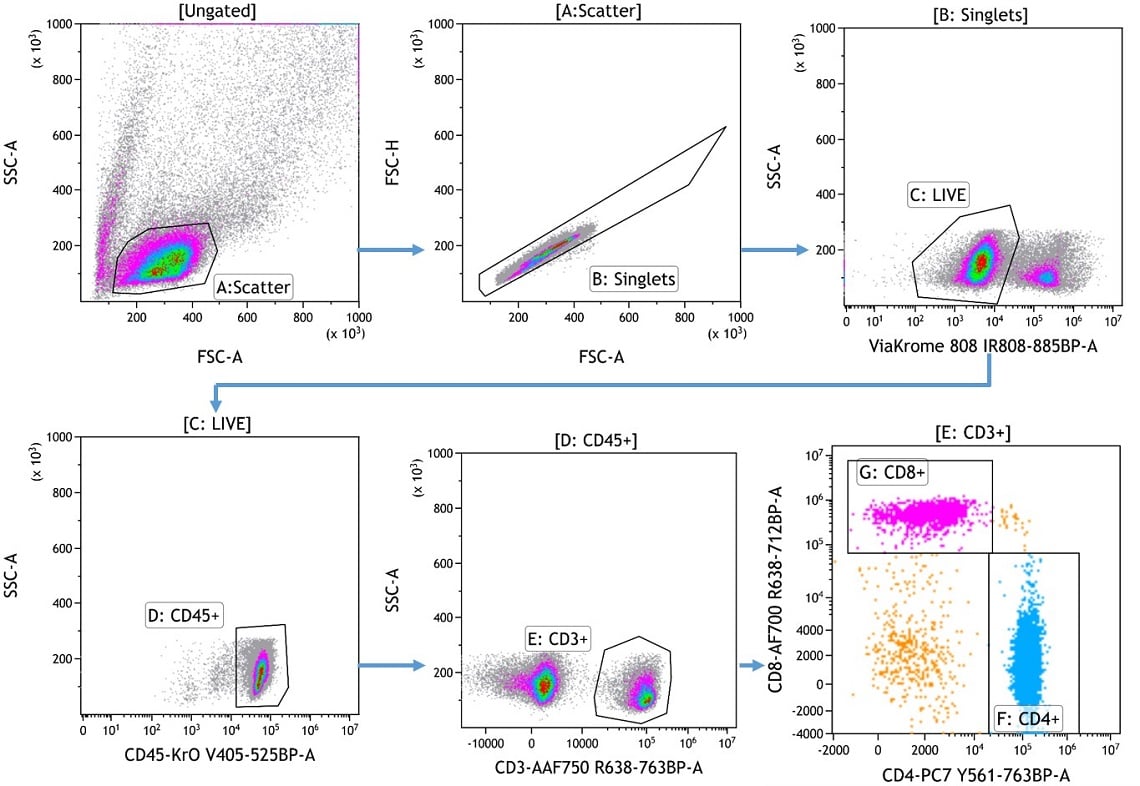
Figure 3. Hierarchical Gating. Hierarchical gating to identify CD4+ (light blue) and CD8+ (pink) T cell subsets. PBMCs were stained using a custom dry reagent panel and data was acquired on a CytoFLEX LX flow cytometer. Plots are for illustration purposes only.
- To set up an Overlay plot select the drop-down arrow on the Overlay icon from the Plots & Tables ribbon tab and select the desired type: Histogram, Dot or Density. In the following section, a Histogram Overlay will be shown as an example.
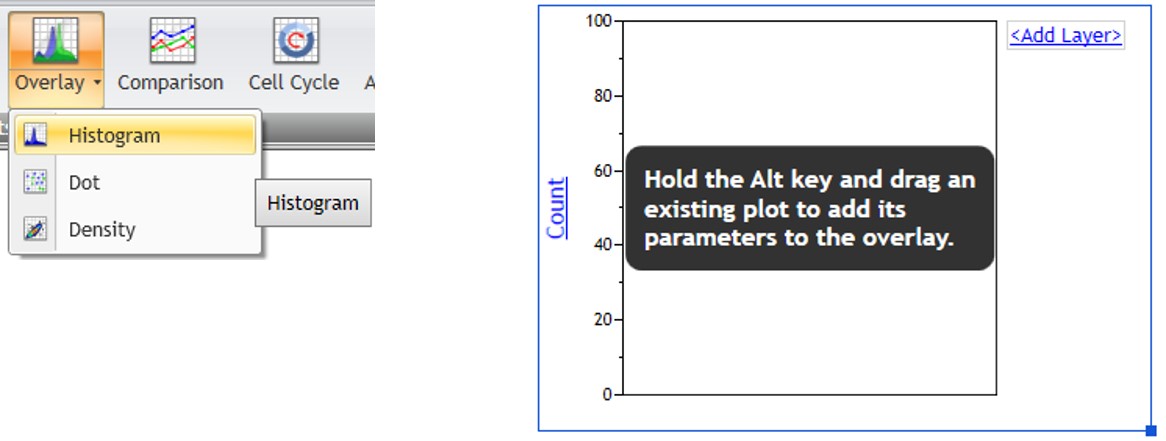
- Use the <Add Layer> hyperlink next to the Overlay plot to select the Input Gate, Parameter, Scale, Color or you can choose Delete to remove a plot.
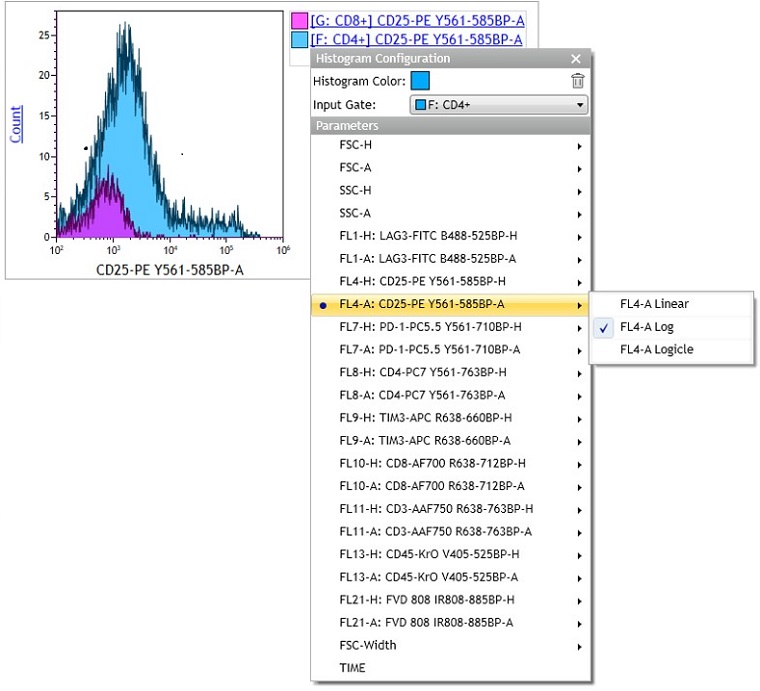
- Continue customizing your plot using the radial menus. In this example, the data scaling was switched to Logicle. Using the Logicle scale negative values display correctly, preserving the desired symmetrical appearance of correctly compensated data and may be beneficial when displaying multicolor data. The y Parameter was changed to % Gated. The % Gated option facilitates comparison of populations that differ in the number of events. Alternatively, the % Max option allows you to normalize Histograms. While % Gated may provide a more accurate representation of numeric differences between data sets, % Max provides a visualization that puts the maximum of all data sets at the same level. Smoothing your data may give it a more pleasant appearance.
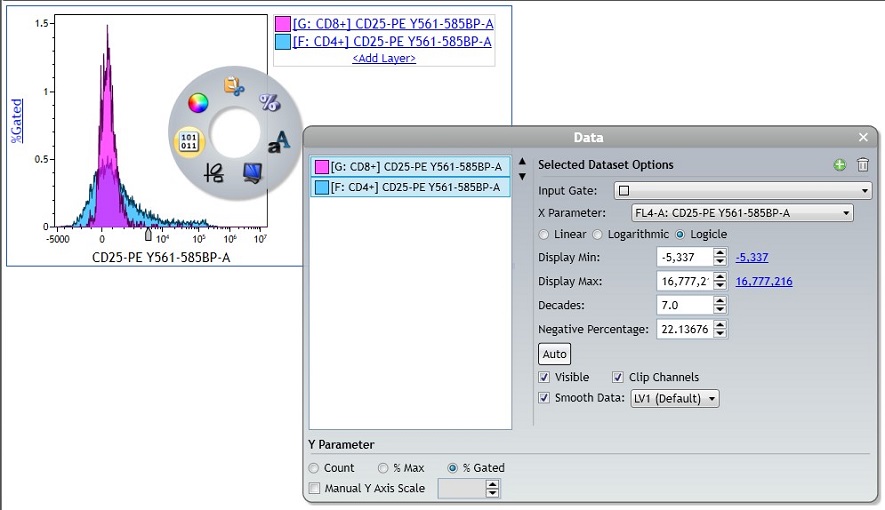
- Use the Display menu to make appearance specifications for the Overlay plot. Select the Histogram Type. The following display options are available:
- Overlay: A composite gallery presentation.
- Offset: Based on scale, offsets each Histogram or plot on the Overlay. Places all Histograms on a vertical offset that fills the chart, scaled to avoid overlap.
- HalfOffset : Uses half the amount of vertical offset for taller Histograms, which may overlap.
- Angle: Angled plots (use pivot point to adjust degree of angle)

TIP FOR SUCCESS:
If all the individual plots use same scale, the axis tick marks will display.
Comparing Populations from Different Data Sets
TIPS FOR SUCCESS:
- To add populations from different data sets to one overlay plot, it is necessary to create a Composite containing all data sets to be compared. For detailed instructions for creating Composites refer to Kaluza Analysis Flow Cytometry Software IFU C10986.
- To avoid having to recreate the gating strategy several times one possible workflow is to create the gating strategy and copy it to all data sets before creating a Composite.
- Load the data files to be analyzed and create a gating strategy identifying the populations to be compared. Use Drag&Drop or Copy + Paste Special to apply the protocol to all data sets. For detailed instructions refer to Kaluza Analysis Flow Cytometry Software IFU C10986.
- Select all Data Sets to be analyzed and create a Composite.
- To set up an Overlay plot select the drop-down arrow on the Overlay icon from the Plots & Tables ribbon tab and select the desired type: Histogram, Dot, or Density.
Use the <Add Layer> hyperlink next to the Overlay plot, a Histogram Configuration or Layer Configuration screen displays, allowing you to select the Data Set, Input Gate, Parameter, Scale, Color, or you can choose Delete to remove a plot. - Continue customizing your plot as described for Comparing Populations Within One Data Set.
Comparing Existing Plots from Different Data Sets or Within One Data Set
- Hold the (Alt) key and drag an existing plot to add its parameters to the Overlay plot.
NOTE: Multiple plots can be dragged into the Overlay plot at the same time if they are multi-selected before pressing the (Alt) key.
Use Case: Creating Overlays of viSNE Maps
If you have data sets that contain tSNE parameters, for example after running a viSNE analysis on the Cytobank platform and downloading the fcs files, you can use Kaluza to create comprehensive viSNE maps containing data from different samples without having to merge the files.
- Load the files containing tSNE parameters.
- Create a Composite containing the samples to be analyzed.
- Create dot plots for all data sets with tSNE1 and tSNE2 as x and y Parameter, respectively. Choose logicle scaling and move the slider to the maximum of the axes to visualize the viSNE map with linear scaling above and below zero.
- Create a Dot Plot Overlay Plot, multi select the dot plots to be added to the Overlay, press the Alt key and drag&drop the dot plots onto the Overlay Plot.

This document does not replace Instructions for Use.
* For Research Use Only. Not for use in diagnostic procedures.

