How Violet Side Scatter Enables Nanoparticle Detection
George C. Brittain, Ph.D., Sergei Gulnik, Ph.D., Beckman Coulter Life Sciences, Miami, FL 33196
Background
The detection of sub-micron particles by flow cytometry becomes increasingly difficult as the particle sizes progress smaller than the wavelength of the light being used to detect them. In addition, the amount of light scattered by any particle is directly proportional to the diameter of the particle and inversely proportional to the wavelength of the light being used to detect it. This relationship can be seen in the equations for both Mie Theory and Raleigh Light Scattering, which are used for calculating theoretical light scattering by particles either similar in size or much smaller than the wavelength of the light being used to detect them, respectively (Bohren & Huffmann, 2010). For this reason, the smaller violet (405 nm) wavelength will result in more orthogonal light scattering at any given particle size than the blue (488 nm) wavelength, and will increase the range of resolution to smaller particles than can be detected by standard side scatter. Moreover, upon entering a medium of a different refractive index, light waves are refracted by the new medium inversely proportional to the wavelength of the light, with smaller wavelengths having a higher refraction than larger wavelengths. This effect was first discovered by Isaac Newton when he split white light into a rainbow of individual colors using a prism, with red light refracting the least and violet light refracting the most (Figure 1) (Newton, 1704).
Based upon this physical property, the use of violet light will help to amplify the difference in the refractive indices between the particles and their surrounding media, and in turn increases the ability to detect particles with a lower refractive index, such as exosomes, microvesicles and silica nanoparticles. The purpose of this paper is to demonstrate how to setup the CytoFLEX flow cytometer to detect small particles by Violet Side Scatter (VSSC).

Figure 1. A simplified depiction of the Newtonian light refraction through a cell based upon wavelength.
Setting up the CytoFLEX to Detect Violet Side Scatter
Setting up VSSC detection on the CytoFLEX is easy. In the CytExpert program, simply select the Cytometer tab within the Menu Bar, and then select Detector Configuration. Within the Detection Configuration pop-up window, replace the 450 nm filter with the 405 nm filter, and appropriately label the detector as VSSC. Once you save the detector configuration, you select that configuration to be the current setting, and physically move the 405 nm filter into the 450 nm slot within the instrument. At this point, you will need to start a new experiment within the CytExpert program for the new detector configuration to apply, and you are ready to go.
Once running, in order to properly separate nanoparticles from background noise using VSSC, you will need to open up the Acquisition Settings Menu, select VSSC as the primary trigger (Height is better than Area), and then manually adjust the trigger level until you reach the discrimination threshold between the noise and actual events. This trigger level is usually very consistent with the CytoFLEX at any given laser intensity and gain setting, both between experiments and on different days.
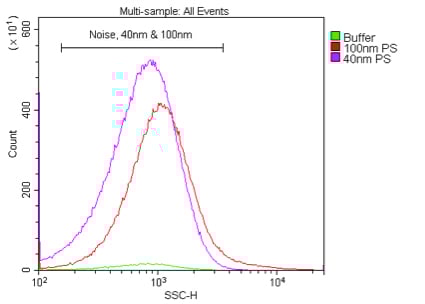
Several considerations to keep in mind are that you will need to adjust the range of the VSSC histogram in order to hone in on the size range of interest since the default chart settings will have the smaller particles pushed up against the y-axis; once within that range, a logarithmic scale will provide for a better distribution of multi-modal particle sizes; and, if the scaling for the Counts axis is selected to “Fit to Sample”, it will always re-scale the data to fit to the entire histogram. The latter issue can create confusion particularly if you set the threshold trigger using buffer alone rather than determining it empirically using the smaller particles of interest. In this case, the histogram for the noise will continue to readjust to the maximum regardless of where you place the trigger, and without the particles as a reference, the chosen trigger setting may actually cut off or eliminate the particles of interest when you begin testing. It is best to set the trigger using the smallest detectable particles that you have available, which can clearly be discriminated from the background noise. Using these, you can hone in on the real sample population, and then back the trigger off until you are comfortable with the level of noise that remains (Figure 2). However, if the chosen threshold level is too low, you will have an increased abort rate due to the noise. Ultimately, you should try to keep the abort rate below 5-10 % either by adjusting the threshold, the sample concentration, or the flow rate. Keeping the sample concentration and flow rate low is also important to prevent experimental artifacts due to coincidence (i.e., swarming) (Nolan, 2015; Nolan & Stoner, 2013).

Figure 2. An example of the separation between a real sample population and background noise while setting the VSSC trigger threshold. This sample is 100 nm polystyrene beads at a 1:100K dilution in 0.02 mm-filtered water.
Considerations for Sample Preparation
The analysis of micro- and nanoparticles requires some careful preparation of the samples to be analyzed. First, the buffer that the samples are suspended in should be filtered with an appropriate molecular-weight cutoff in order to eliminate any background debris that may fall within the range of your populations of interest. Second, as is commonly mentioned in protocols and data sheets, the samples should not be mixed in such a vigorous manner as to create air bubbles immediately prior to reading. These bubbles will interfere with data acquisition, as they
also refract light and will be detected as events. Third, a lot of small synthetic particles have the tendency to clump together, resulting in the formation of aggregates that may be either inaccurately sized or aborted altogether. In the case of either bubbles or aggregation, sonicating the samples prior to reading can help. After sonication, the samples should be read as quickly as possible because aggregation will begin anew and the sample population(s) will be affected over time (Figure 3). If sonication is not acceptable, such as with biological samples, then simply triturate the samples as well as possible in order to evenly distribute the sample prior to acquisition. Finally, the concentration of the sample should also be titrated in order to determine the optimal working range for acquisition by flow cytometry, as higher concentrations will lead to aggregation and/or swarming (Figure 4).
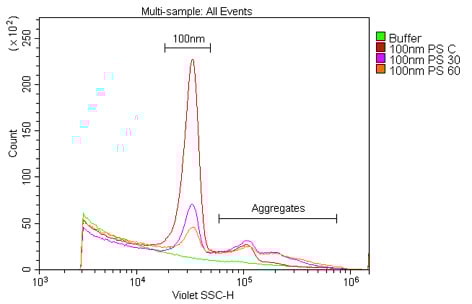
Figure 3. The reduction in signal of a polystyrene nanoparticle population over time. These samples are 100 nm polystyrene beads at a 1:100K dilution in 0.02 mm-filtered water read at 0, 30, or 60 minutes after sonication.

Figure 4. Finding the optimal concentration for the nanoparticle sample. These samples are 100 nm polystyrene beads in 0.02 µm-filtered water at a dilution of 1:1K, 1:10K or 1:100K from the 1 % stock solution. From these results 1:100K could clearly be seen to provide both the best signal and least aggregation or swarming of the dilutions tested.
Testing the Performance of the CytoFLEX with Nanoparticle Detection by Violet Side Scatter
The objective of the following experiment was to demonstrate the ability of the CytoFLEX to detect nanoparticles smaller than 200 nm by the use of VSSC.
Instrument and Reagents
| PRODUCT | CATALOG NUMBER | COMPANY |
| 3-Laser CytoFLEX | B53000 | Beckman Coulter |
| CytoFLEX Sheath Fluid | B51503 | Beckman Coulter |
| Whatman Anotop 25 0.02 μm Filteres | 09-926-13 | Thermo Scientific |
| 40 nm Polystene Beads NIST | 09-980-015 | Thermo Scientific |
| 100 nm Polystene Beads NIST | 09-980-021 | Thermo Scientific |
| 200 nm Polystene Beads NIST | 09-980-024 | Thermo Scientific |
| Multimodal Particle Size Standards | MM-010 | Thermo Scientific |
| 94 nm Silica Beads NIST | 147020-10 | Corpuscular, Inc. |
| 150 nm Silica Beads NIST | 147030-10 | Corpuscular, Inc |
| 200 nm Silica Beads NIST | 147040-10 | Corpuscular, Inc |
Results
We first compared the sensitivity of nanoparticle detection by 405 nm VSSC to standard 488 nm SSC using Duke Multimodal Particle Size Standards with a mix of 80 nm, 200 nm and 500 nm polystyrene beads. As can be seen in Figure 5A, the VSSC could easily discriminate the smaller 80 nm and 200 nm particles, while SSC did not begin to discriminate the populations until between 200 nm and 500 nm. Determining the signal-to-noise ratios of the different populations detected by FSC, SSC, or VSSC, the VSSC can be seen to perform better than SSC at all measured particle sizes (Figure 5B). By histogram, you can more clearly see the population densities and that the CytoFLEX using VSSC was easily able to discriminate polystyrene nanoparticles down to 80 nm using the Duke Multimodal Particle Size Standards (Figure 6). Polystyrene particles as small as 40 nm were able to be clearly detected above background, but they were located right on the noise threshold (Figure 7). Since the polystyrene beads have a refraction index of 1.5915 (at 589 nm), we also tested silica nanoparticles with a refraction index of 1.4584 (at 589 nm), closer to the range for exosomes and microsomes, which have a mean refraction index of around 1.426 (Gardiner et al., 2014). As a result, we were able to easily discriminate 150 nm and 200 nm silica nanoparticles, while 94 nm silica nanoparticles were detectable but on the noise threshold (Figure 8).


Comparing the sensitivity of nanoparticle detection by 405 nm VSSC to 488 nm SSC. Duke Multimodal Particle Size Standards (80 nm, 200 nm and 500 nm) in 0.02 μm-filtered water at a 1:10K dilution were analyzed using the CytoFLEX. Dot plot showing VSSC vs. SSC (A). A plot of the signal-to-noise ratios for the different nanoparticles using FSC, SSC, or VSSC. (B).
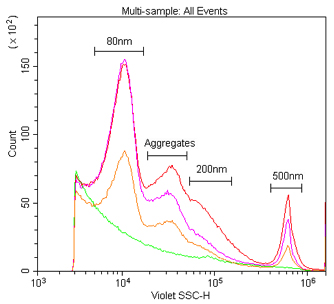

The detection and discrimination of 80 nm, 200 nm and 500 nm polystyrene nanoparticles by VSSC and SSC. These are Duke Multimodal Particle Size Standards (80 nm, 200 nm and 500 nm) in 0.02 μm filtered water at a dilution of 1:1K, 1:10K or 1:100K from the 1 % stock solution detected by 405 nm VSSC (A) and 488 nm SSC (B).
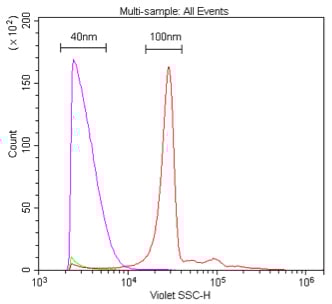
. Comparison of 405 nm and 488 nm scatter detection of 40 nm polystyrene nanoparticles. These samples are 40 nm or 100 nm polystyrene beads in 0.02 μm-filtered water at a dilution of 1:10K or 1:100K, respectively (1 % stock) detected by 405 nm VSSC (A) or 488 nm SSC (B).
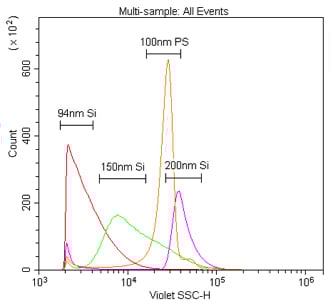
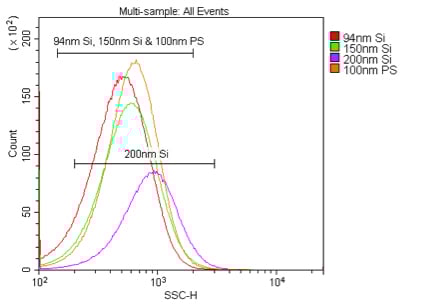
Comparison of 405 nm and 488 nm scatter detection of silica nanoparticles. These samples are 94 nm, 150 nm or 200 nm silica or 100 nm polystyrene nanoparticles in 0.02 μm filtered PBS. The silica nanoparticles were diluted 1:10K, while the polystyrene nanoparticles were diluted 1:100K, from the 1 % stock solution detected by 405 nm VSSC (A) or 488 nm SSC (B).
Conclusions
Using VSSC, the CytoFLEX was able to clearly discriminate 80nm polystyrene and 150 nm silica nanoparticles from background noise. Moreover, the detection and discrimination of nanoparticles by VSSC was better than SSC for all particle sizes tested. Based upon these findings, we can confidently say that the CytoFLEX can be used for the detection of extracellular vesicles at least as small as 150 nm by VSSC. It may be possible to use VSSC to detect even smaller vesicles, as previous research has suggested that the refraction index of extracellular vesicles is inversely proportional to the size of the vesicles, with smaller 50 nm vesicles having a refraction index closer to 1.6 (similar to polystyrene) (Gardiner et al., 2014); however, this will need to be determined empirically.
References
1. Arraud, N., Gounou, C., Turpin, D., Brisson, A.R (2015). Fluorescent triggering: a general strategy for enumeration and phenotyping extracellular vesicles in flow cytometry. Cytometry Part A, doi: 10.1002/cyto.a.22669. [Epub ahead of print]
2. Bohren, C.F. & Huffmann, D.R. (2010). Absorption and scattering of light by small particles. New York: WileyInterscience.
3. Gardiner, C., Shaw, M., Hole, P., Smith, J., Tannetta, D., Redman, C.W., and Sargent, I.L. (2014). Measurement of refractive index by nanoparticle tracking analysis reveals heterogeneity in extracellular vesicles. Journal of Extracellular Vesicles, 3: 25361-25366.
4. Hielscher, A.H., Mourant, J.R., and Bigio, I.J. (1997). Influence of particle size and concentration on the diffuse backscattering of polarized light from tissue phantoms and biological cell suspensions. Applied Optics, 36(1): 125-135.
5. Newton, I. (1704). Opticks: or, a treatise of the reflexions, refractions, inflexions and colours of light. Also two treatises of the species and magnitude of curvilinear figures. London: Samuel Smith & Benjamin Walford (Printers to the Royal Society).
6. Nolan J.P. (2015) Curr Protoc Cytom. 73: 13.14.1-13.14.16.
7. Nolan, J.P, & Stoner, S.A. (2013). A trigger channel threshold artifact in nanoparticle analysis. Cytometry Part A, 83(3): 301-305.
8. Poncelet, P., Robert, S., Bouriche, T., Bez, J., Lacroix, R., Dignat-George, F. Cytometry Part A doi: 10.1002/ cyto.a.22685. [Epub ahead of print]
